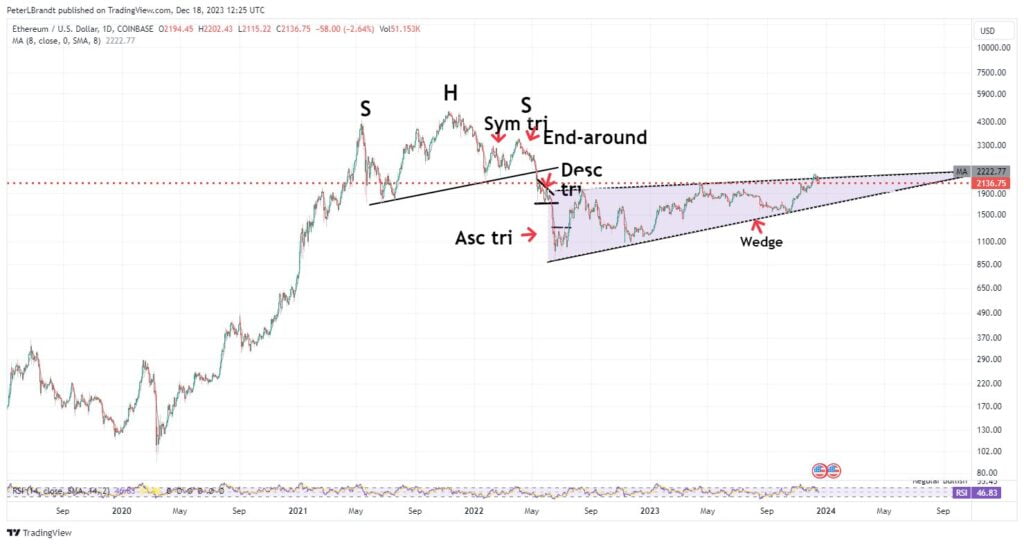
Ethereum, the world’s second-largest cryptocurrency, finds itself at a critical juncture, trapped within a wedge formation. Veteran trader Peter Brandt has cast his gaze upon this chart pattern, and his insights offer both potential rewards and stark warnings for Ethereum investors.
Key Takeaways:
- Ethereum’s price is currently trapped within a wedge formation, presenting both upside and downside potential.
- Veteran trader Peter Brandt sees a potential price target of $1,000 if the wedge breaks up, but warns of a possible plunge to $650 if it breaks down.
- Brandt’s own trading position highlights the potential rewards and risks associated with navigating this technical pattern.
- A balanced perspective, considering both technical and fundamental factors, is essential for making informed investment decisions regarding Ethereum.

Ethereum Price Forms Uncertain Wedge:
Brandt identifies a descending wedge pattern on Ethereum’s price chart. This technical formation, characterized by converging upper and lower trendlines, can signal either a breakout or a breakdown. In this case, a breakout above the upper trendline could propel Ethereum towards his price target of $1,000. However, a breakdown below the lower trendline could trigger a precipitous drop, sending Ethereum plummeting to $650.
Brandt’s Risky Gambit:
Interestingly, Brandt’s own trading position reflects his cautious optimism. He highlights the “extremely favorable R:r set up,” indicating a potentially high reward-to-risk ratio. This suggests he has positioned himself to capitalize on a potential upward breakout while minimizing losses in case of a breakdown.
Beyond the Chart:
While Brandt’s technical analysis offers valuable insights, it’s crucial to remember that price movements are influenced by a multitude of factors. Ethereum’s future trajectory will depend not only on chart patterns but also on broader market sentiment, regulatory developments, and unforeseen events.
Further Reading on Ethereum:

